
A couple of years ago I have written several articles that explain how to build a mobile checkout on smileywar.com. These articles based on one of the best performing checkout applications I have ever built. I was very happy with the functionalities and visual aspect, but there is always room for improvement. So yesterday I have developed my own analytic program that registers the movements of customers in the checkout. I came to the conclusion that the success rate was only 18%, meaning 82% dropped of for whatever reason it was. Does that mean I had developed a bad checkout?
It’s not that I created a bad checkout system, but one that has room for improvements. There are so many factors that can cause a customer not to continue and make the final payment. Each checkout application has its own challenges.
How most people learn tips
Many people read articles, and based on these articles will make an assumption that whatever is said in the article is correct. Which is a great starting point if you’re a novice. But these articles are really basic, and most articles just repeat what others say. Sure in some situations the tips are invaluable, but be careful not to fall in old traps.
How you should learn tips
To understand your customer you need raw data, every website has different information based on how the website was created. For some getting raw data is easy, for others harder, but I will explain in both situations what you can do.
I am not here to tell you any statistics or fabrications for that matter. Each online store is unique and has its own problematic areas. Some of these problems are general, some or maybe all are related to the individual website.
Can I use online tools that track website movements?
I think the only application that is close enough to give you all the information is Google Analytics. But setting it up or adapting it to each unique checkout program can be a difficult task.
1) The Drop off rate?
The drop off rate can be different with every industry, a 60% success rate is regarded as a pretty perfect eCommerce website. Anything lower and you know that you need to improve on areas. For example my clients drop off rate is 82%, that is incredibly high. I definitely know there is something wrong.
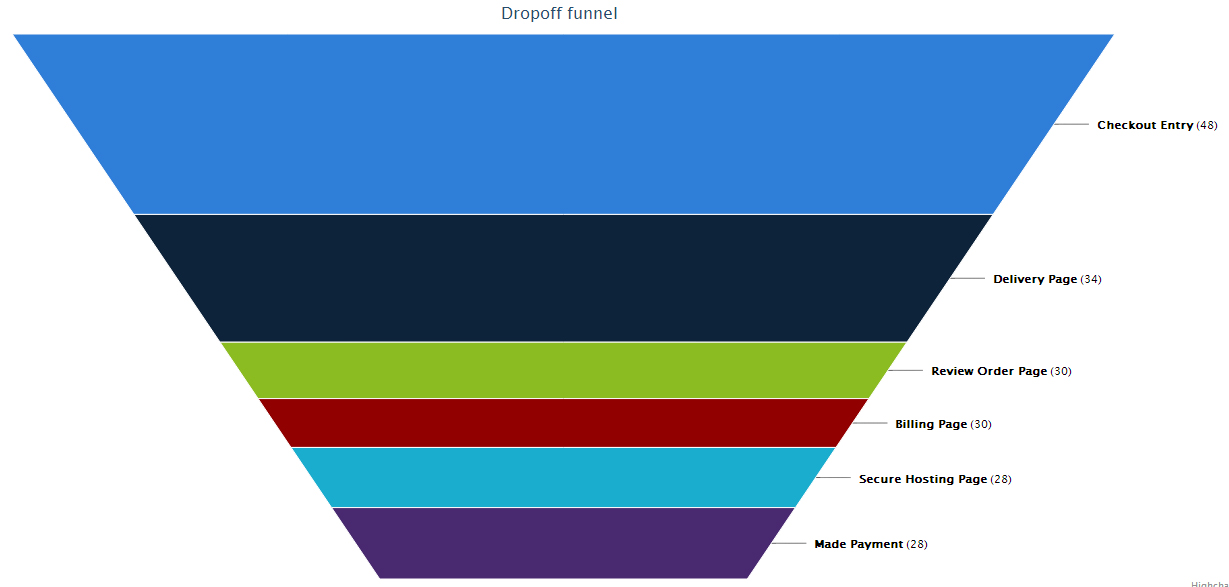
I logged every single step of the checkout and displayed automatically the information in a nice funnel chart.
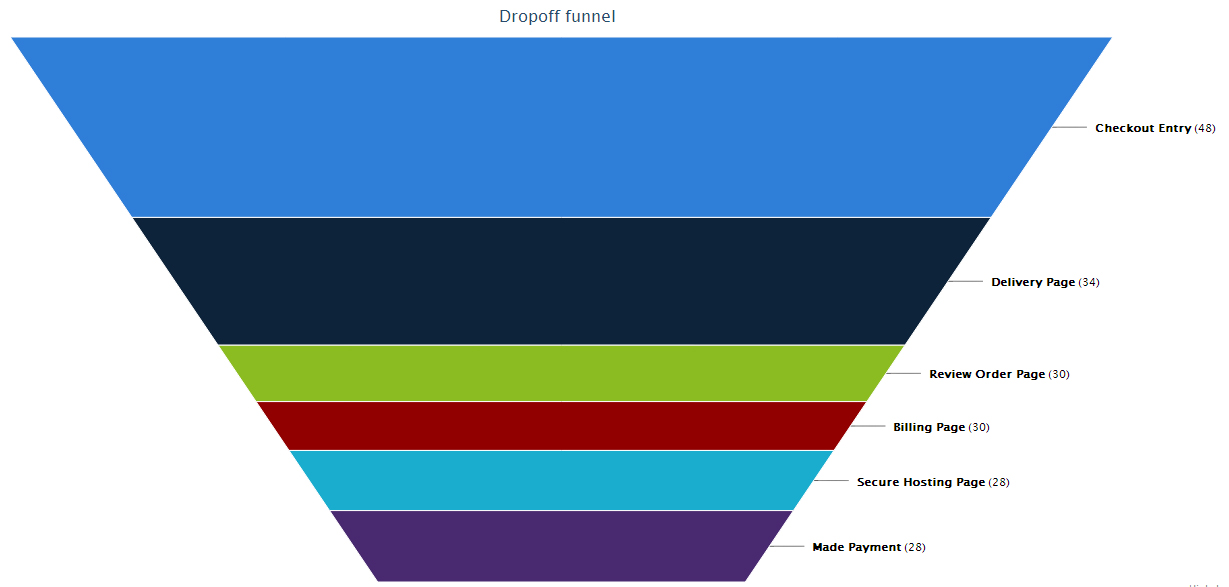
What I found out was that in the second step, a lot of people where dropping off. So I looked at the second stage and tried to understand what could go wrong. What I found out was that when there is an error displayed (when a customer did not fill in a required field), they didn’t really notice some errors until you scroll through the section. The errors were highlighted with a thick border and a big red error tag. But not always visible in the port view.
The Fix
I fixed this problem by incorporating an auto scroll function to the highlighted error, so that the customer instantly see that there is an error on the page, without the need to look for it.
The data I collected after the fix was much better, originally the drop off rate was 82% I managed to decrease it to 60% after one day of testing. That is a significant improvement.
So 60% is not the target, I need to get it down to 40%, the improvements that are already visible after a days work is a great success, my employers where extremely happy that I improved the conversion rate by 100% . So now you know there is always room for improvement, so take a deep breath and continue reading 🙂
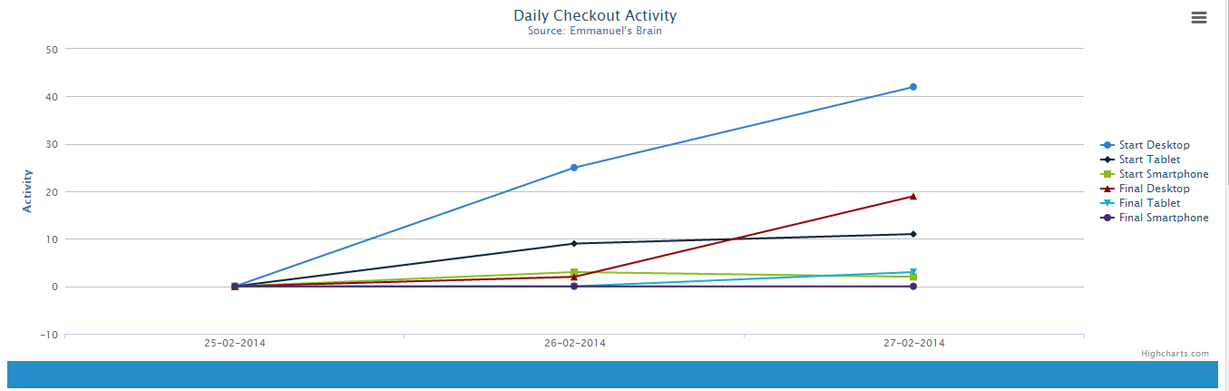
2) Which devices are causing the highest drop off rates?

In the UK, I have seen an increase of up to 45% in mobile traffic, this consists of Tablets and Smartphones. So it is not just desktops that you need to look out for but also other devices. You need to know how many people enter the checkout using each device and how many complete the checkout.
As I built my own analytics tool I could divide the tracking in 3 sections, Desktop, Tablet and Smartphone. This so I can see how much the drop off rate is for each device.
3) Lets assume both Tablets and Smartphones have the highest drop off.

Here is a list of basic causes that can negatively impact smart phone drop off rates
- Is it mobile friendly?
- Have you optimized for slow connections? (3G, 4G, WiFi or other types of connection)
- Are your buttons large enough?
- Do you show customer input errors visually correct?
- Do you show payment methods?
And many more other small details, check out the links below for more pointers on building a mobile checkout
- Part 1 : The basics on how to build a mobile checkout
- Part 2 : How to visually styling a mobile checkout
- Part 3 : Validating email addresses using jQuery for mobile checkout
- Part 5 : Validating credit cards with jQuery using Luhn Algorithm
- Part 6 : jQuery checking for empty form fields
4) Assume desktops have the highest drop off rates.
With the basic information of the drop off rate, you will need to check for basics in your checkout.
- Is it cross browser friendly?
- Are you supporting older version of browsers?
- Do you use 3rd party hosted plugins, are these causing delays?
- Is your payment gateway perfect?
- Do you have errors on the page?
- Is everything logical?
- Do you ask for a registration? (Can cause frustrations with many customers)
There are tons of issues that can be inside your checkout, but it is extremely hard to understand what it can be, the best way is to start correcting the most obvious problems. Once you have fixed all the most obvious problems you need to fine tune the tracking. Read step 8 for a more in-depth tracking.
5) Drop off rate at the payment gateway of the checkout

Lets assume you have fixed the most obvious problems, but still have a high drop off rate. You need to eliminate the next problem. Most of you who are reading this article will have built a custom checkout with a 3rd party gateway or are using a plugin that does it all for you. Regardless of the checkout system, you need to eliminate if the payment gateway is causing a problem.
As soon as the customer enters the checkout you need to track its movements till you reach the 3rd party payment gateway. If you see that the drop off happens just after the click to enter the payment gateway, than you know that there is a problem.
So how do you resolve it? The most obvious advice I can give you is to ask the company who hosts the gateway for advice. Tell them that your analytic show an extremely high drop off rate, and you need answers, with the tool I built I can see which device it is and what internet speed it has, etc…. If they don’t want to help, than its time to move on. When you move on be sure that your analytic is correct, double-check all your scripting.
6) Drop off rate happens at the first stage
Lets assume the drop off rate happens on the first stage. This can be caused by many factors, as I have no insight in to each checkout platform I will give you a generic problem solving check-list.
- Do you have the option for guest login?
- If returning customers are lower than 40% do you really need a registration process?
- Do you show the minimum delivery price? And if so do you have the price next to each product on the product pages?
- Do you offer international delivery? If yes, is it clear on the main page and on each product page? If no you should start tracking for international customers, if you have a high percentage, maybe it is time to start selling internationally?
- Do you show VAT or TAX exclusive prices? If yes maybe you should not show them. If your clients are more non business related, than people are not interested in the VAT or TAX price. It just ads more confusion.
- Do you show privacy policy? No, than add one.
- Do you show returns policy? No, than add one.
Try to track as much as possible, from the time it takes to go through each step, to what they have added or removed in the checkout.
7) What time of the day are your customers entering the checkout at?
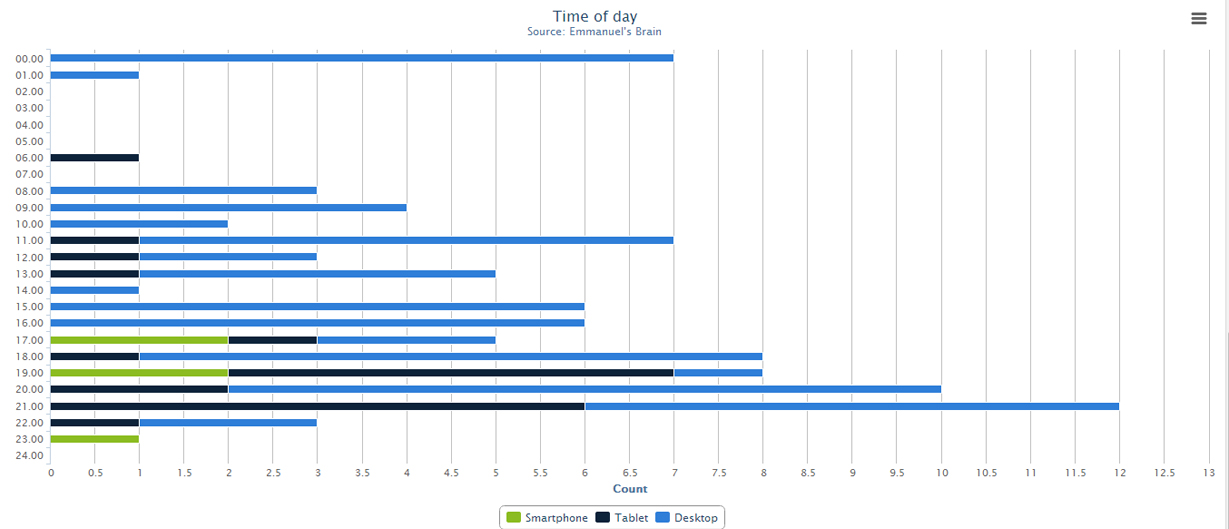
Depending on the time of the day, you need to track when the customer enters the checkout. This can give you valuable information. For example in combination with the statistics from the drop off rate you can see if the drop off is higher during the day, but not in the evening. Than you can be sure that the customers have problems ordering during the day.
Why can this be?
- Not enough time?
- Company WiFi blocks certain sites, or payment portals?
- Are on a company computer which does not allow certain things?
- In combination with detecting the connection speed, you can see if it’s a slow connection that they can’t or don’t want to order.
- Check how long the session is, if they are on the checkout for a split second, than you know it’s a fluke. If its longer than 10 seconds, than you need to figure out what the cause is.
9) A list of in-depth tracking
- Which device is the customer using
- What is the drop off rate per checkout stage
- How long is the customer taking to complete the checkout
- What time of the day are the customers entering the checkout
- Are they increasing or decreasing quantities in the basket
- Do they exit the checkout to order other items
- How many input fields does the customer enter before quitting
If you want to discuss anything simply leave a comment!
Contact me if you need help setting up an analytics report.