Yesterday Google released data on eligible badges. Today, Google released competitive visibility data. The new competitive visibility report allows you to view your competitor’s data, such as relative visibility, page overlay rate, and higher position. Not only that, but you can also see the top merchants’ competitive data within your target categories.
Currently, it is in open beta, and not all accounts will have access to this (US Only).
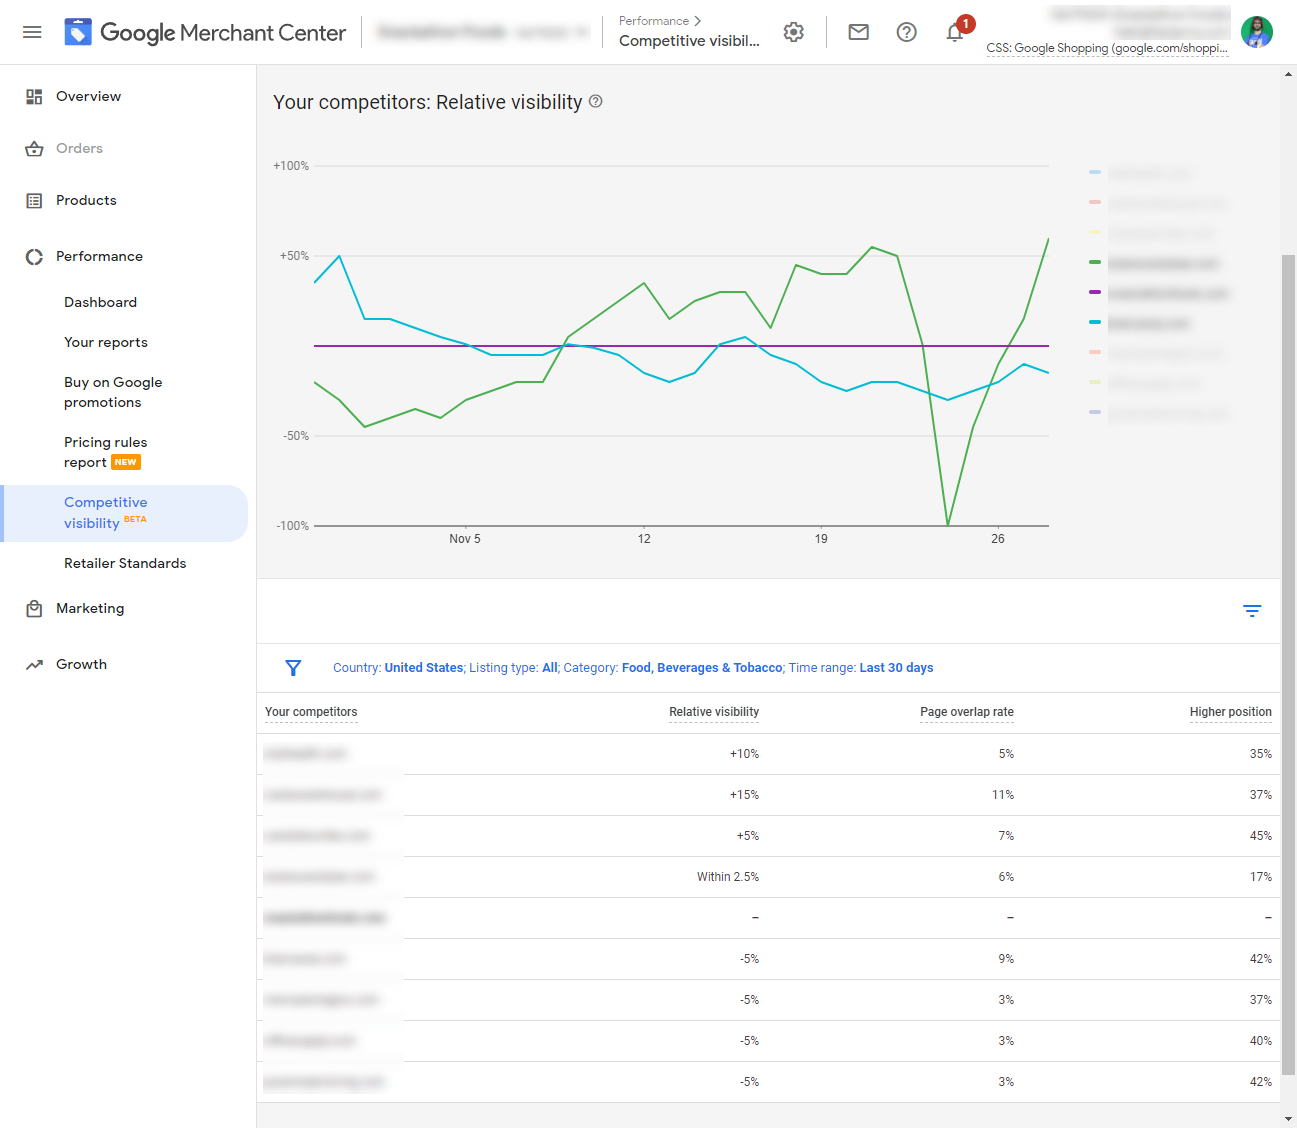
The competitive visibility reports allow you to understand better how your competitors are performing relative to your performance on the same page, which is available for shopping ads and free listings.
Knowing how well you perform compared to your competitors allows you to focus on improving those areas, such as product data feed improvements and campaign setup.
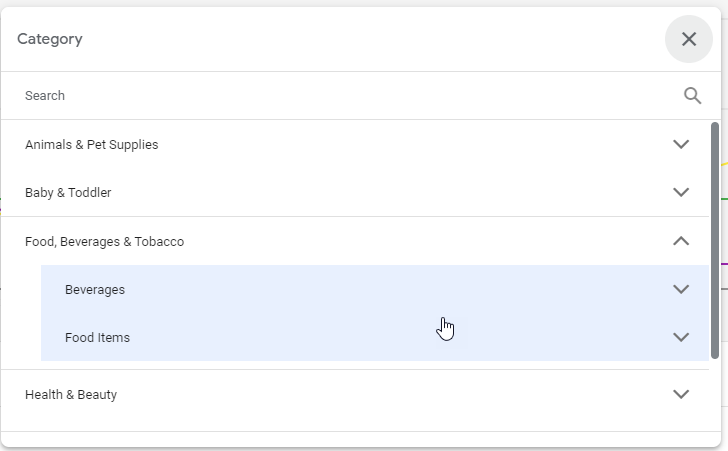
You can drill down products by choosing your categories, allowing you to see more specific reports.
There are 3 metrics we can look at:
Relative Visibility
Relative visibility shows the number of times another merchant’s products were shown relative to the number of times your products were shown.
For example, if a merchant received 5% more impressions than you, their Relative visibility would be +5%.
Page Overlap Rate
Page overlap rate shows how often you and another merchant received impressions on the same page.
Higher Position
The higher position shows how often a merchant appeared in a higher position than you on the same page.
How Can You Use The Data?
In the below example, I have drilled down the category for coffee creamer. Comparing the last 30 days vs last 90 days, I can see the top competitor’s relative visibility changed from +2.5% to +20%.
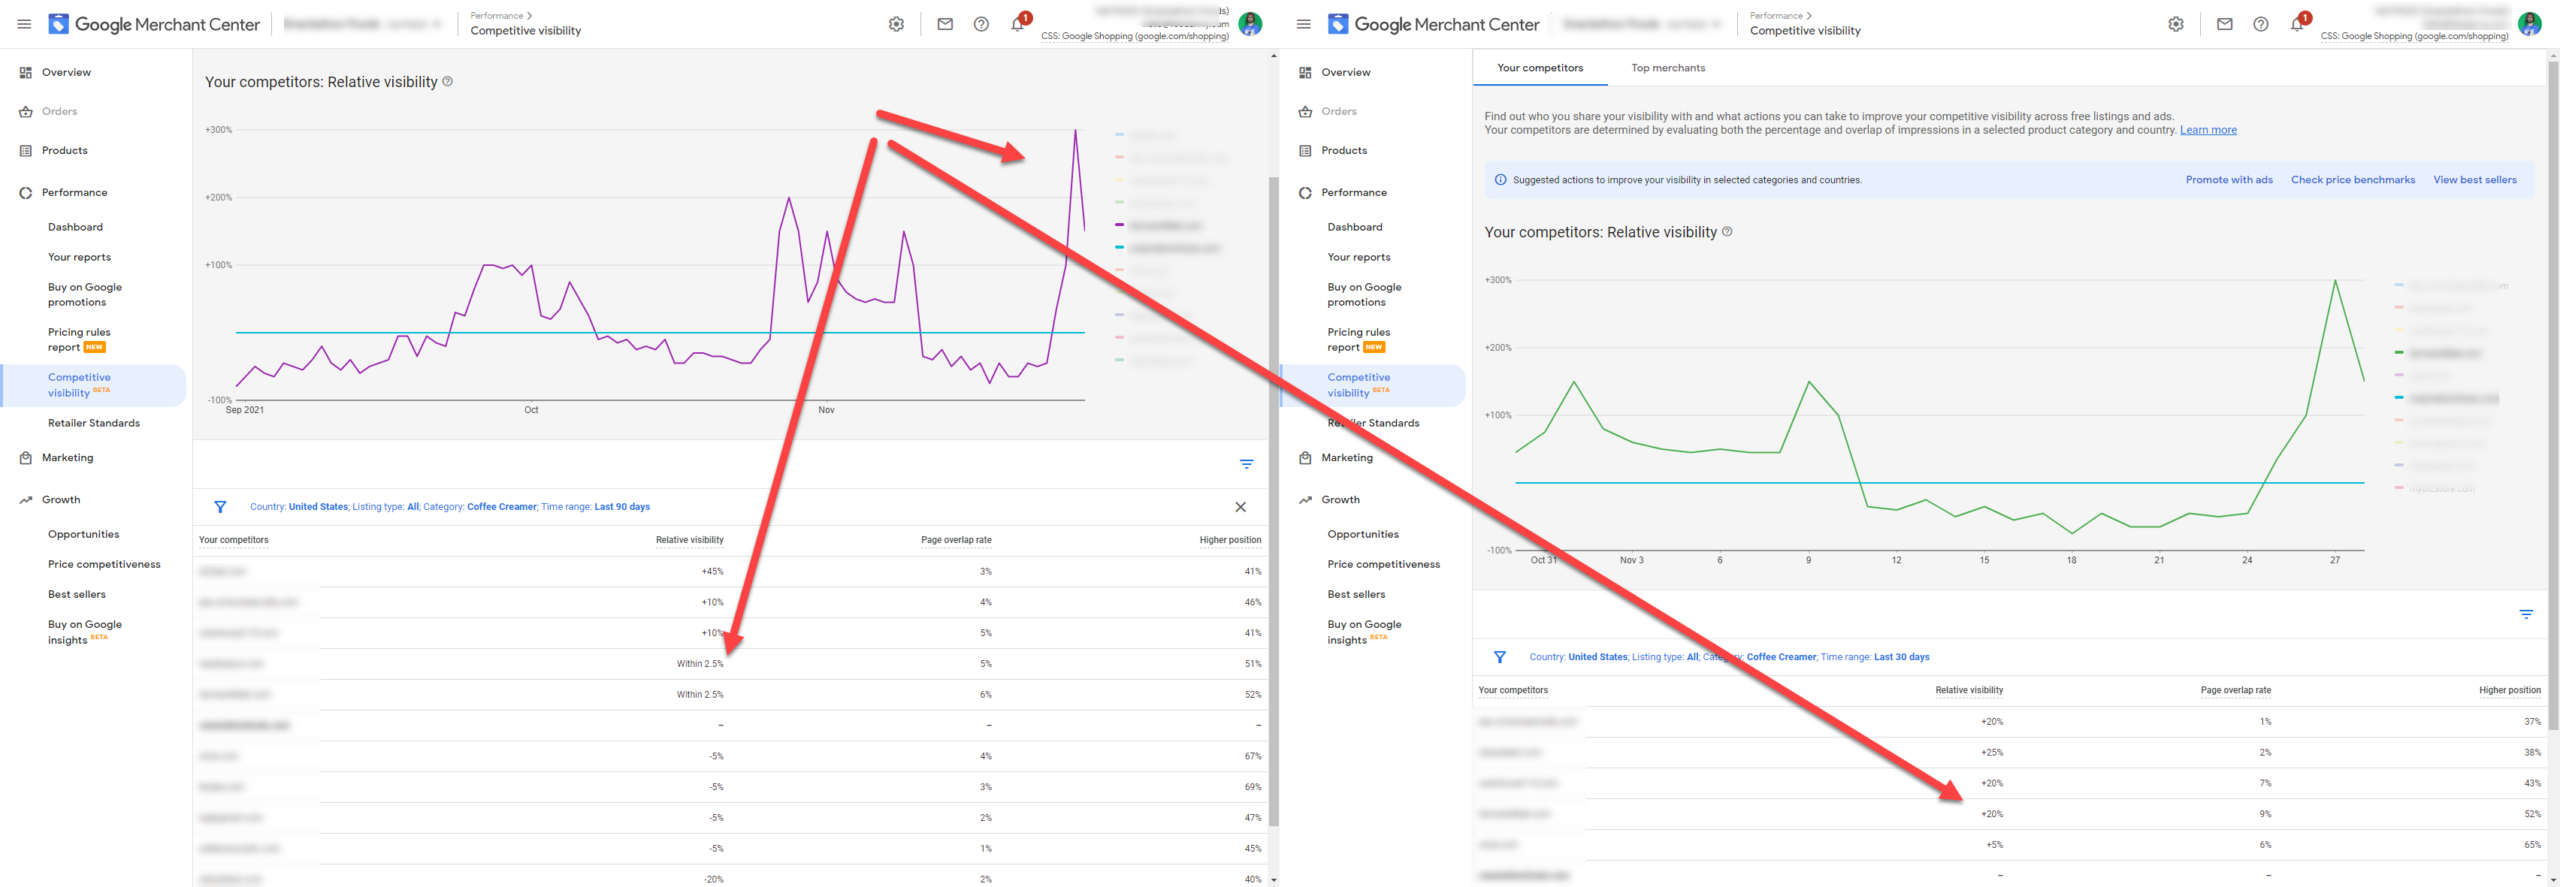
This means that relative to this competitor, they have improved by 17.5%. Be it they went backward, or we went forwards.
The first and easy step is to understand if the performance increase for this company was due to lower pricing.
In this case, we can see that the performance boost came from Black Friday. This may have indicated that they have dropped the pricing, had a promotion, bid much higher, or had better data quality.
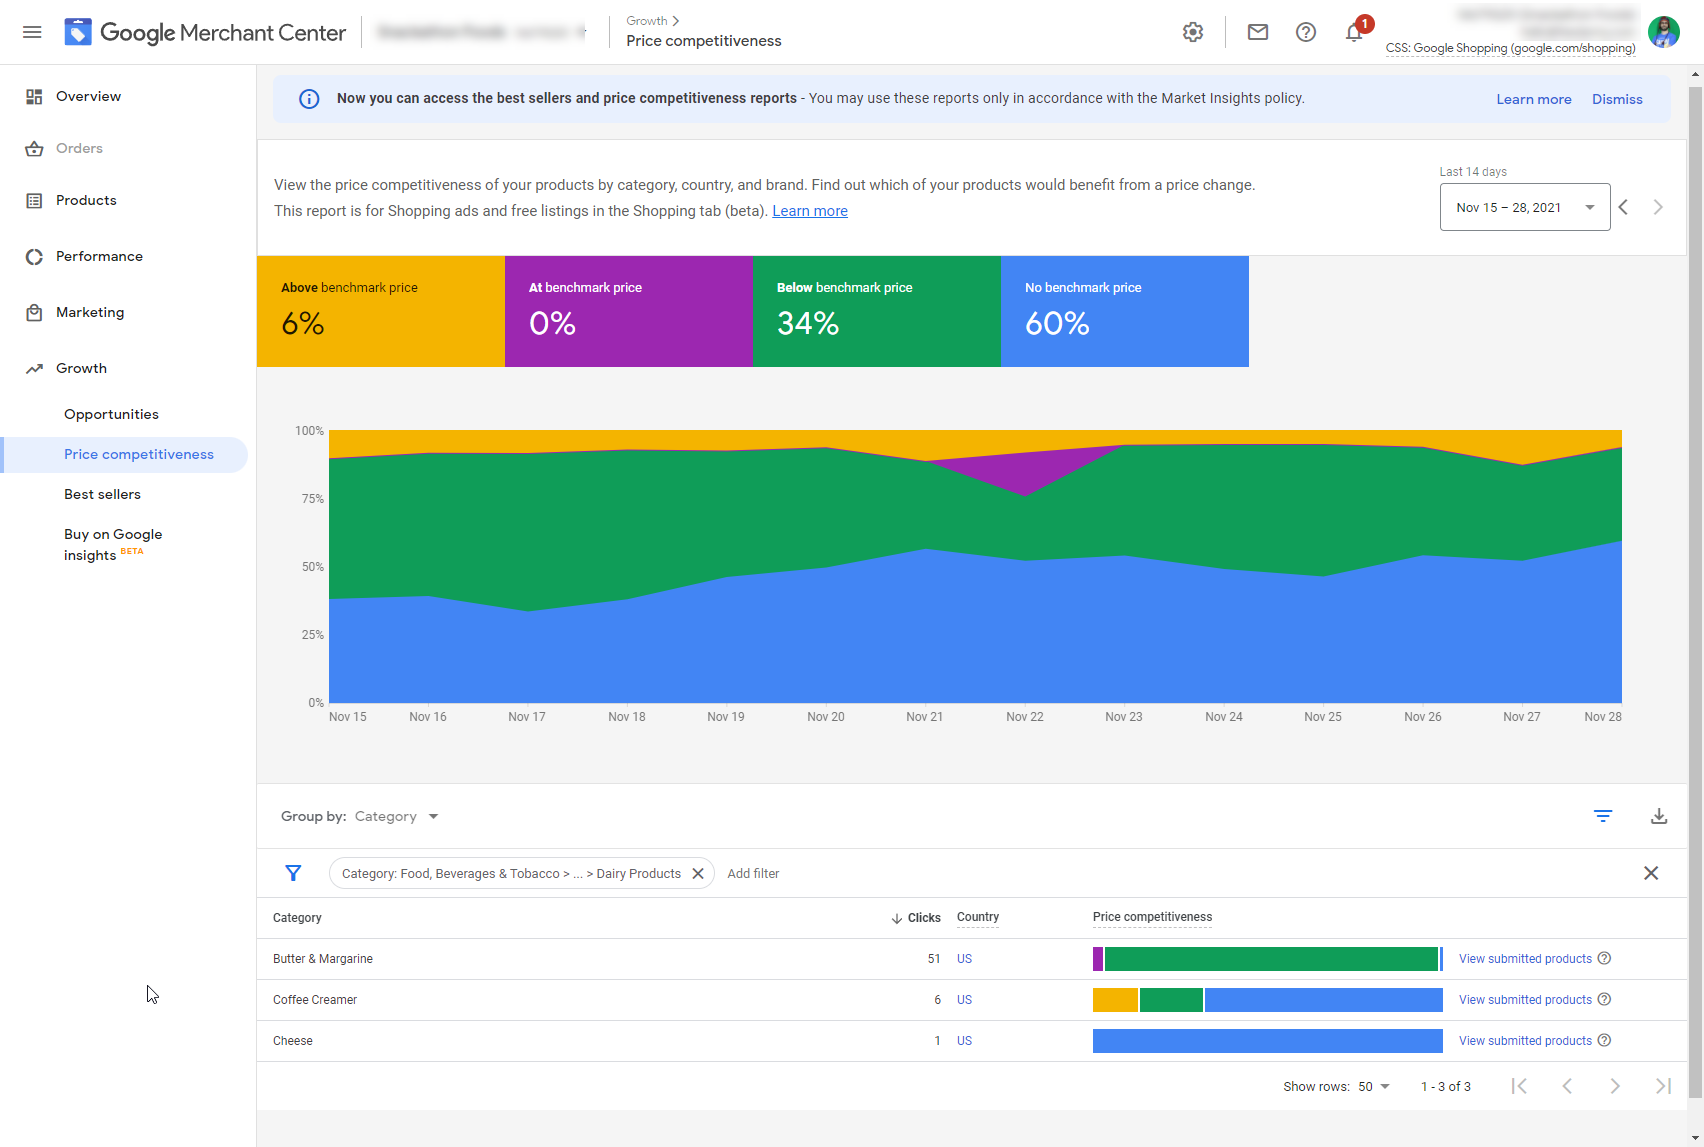
You can check if it’s due to pricing by viewing the price competitiveness data. As we can see in the screenshot below, we can see that the benchmark price is the same, and nothing has changed. So we can exclude the idea that it is not a price drop.
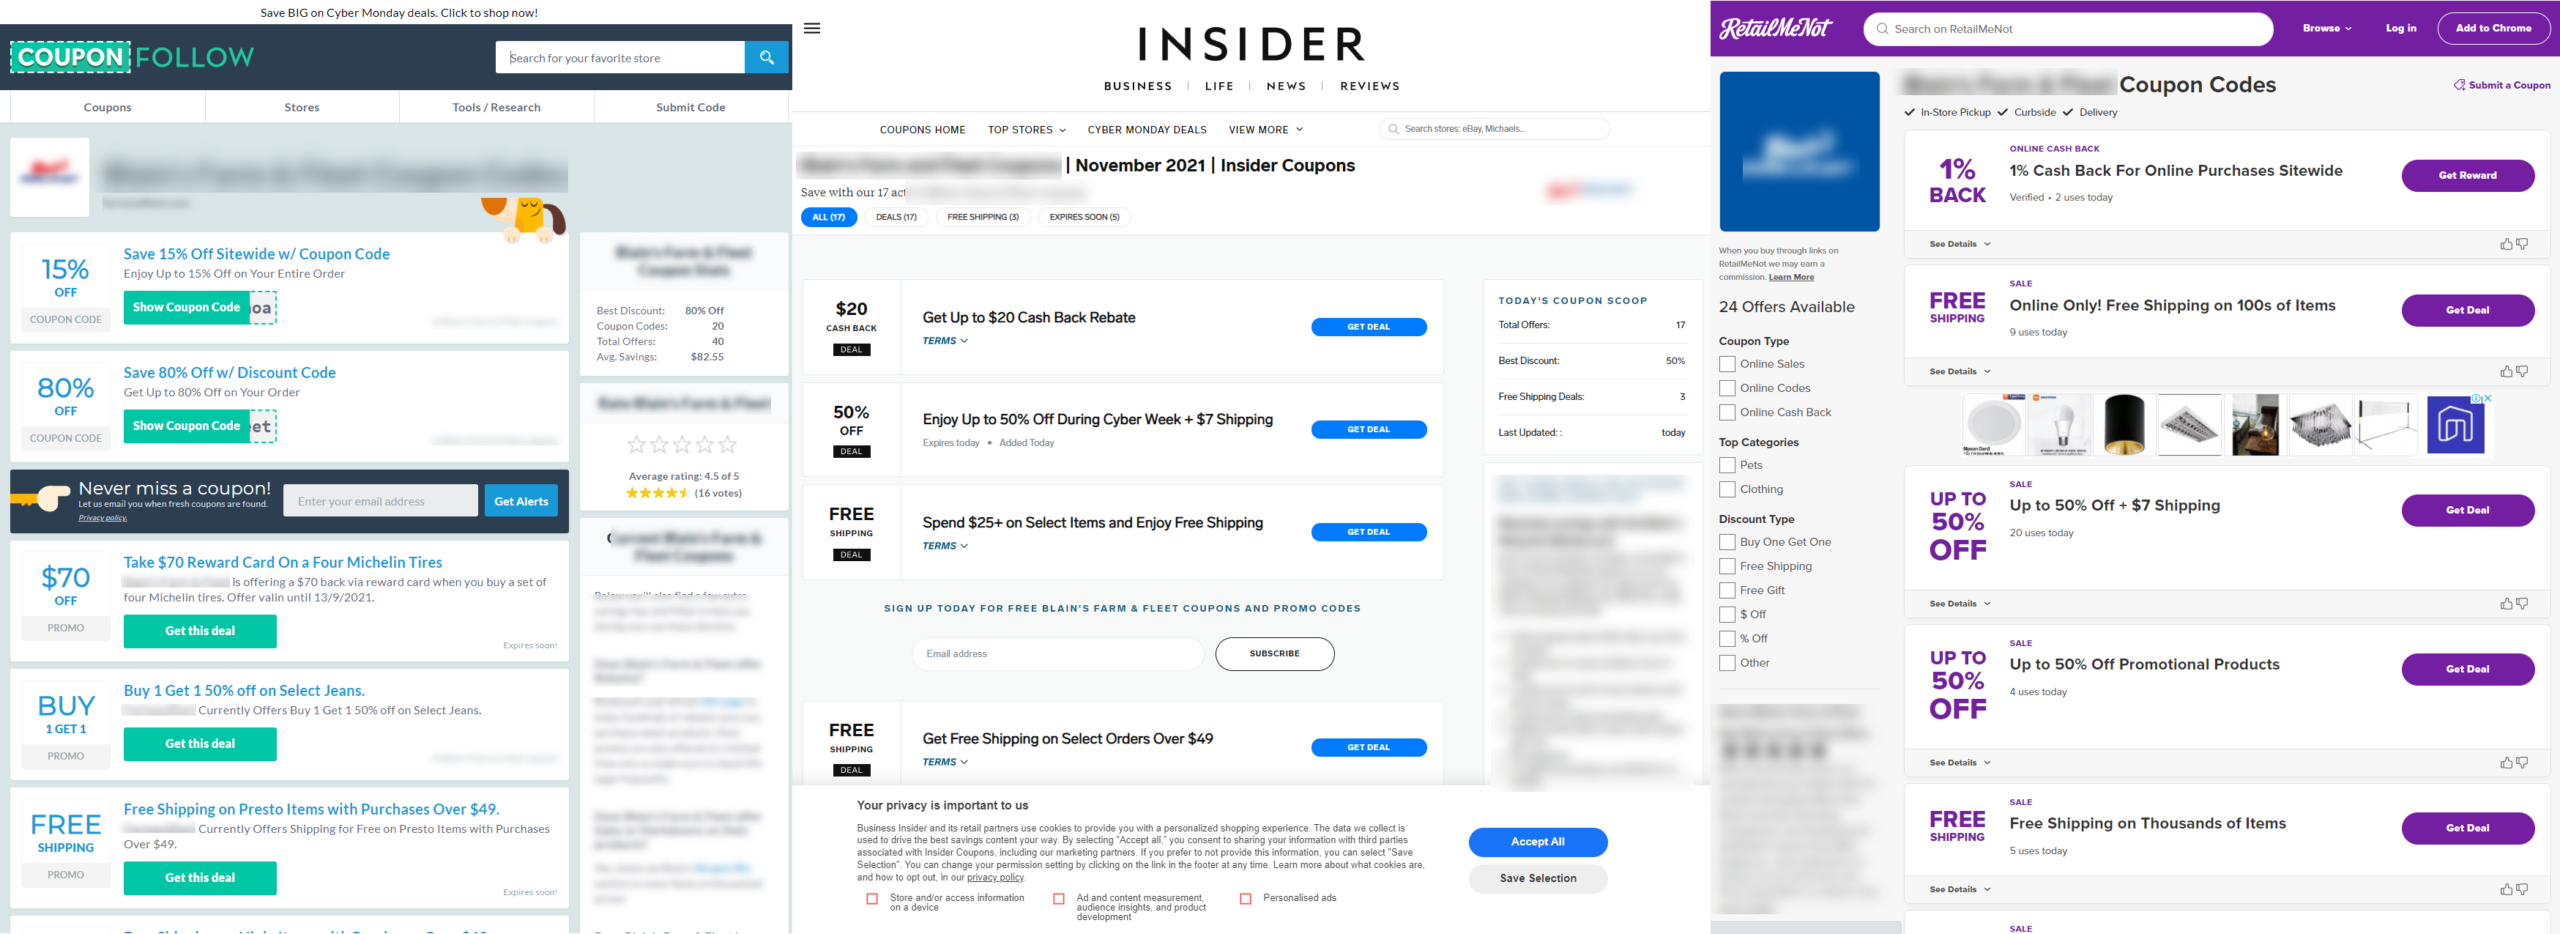
Now let’s check if it was a promotion. If we search for company domain name + coupons, we can check coupon aggregators for any recent promotions. In this case, we can see that they had several promotions. You can also check when the promotions expire.
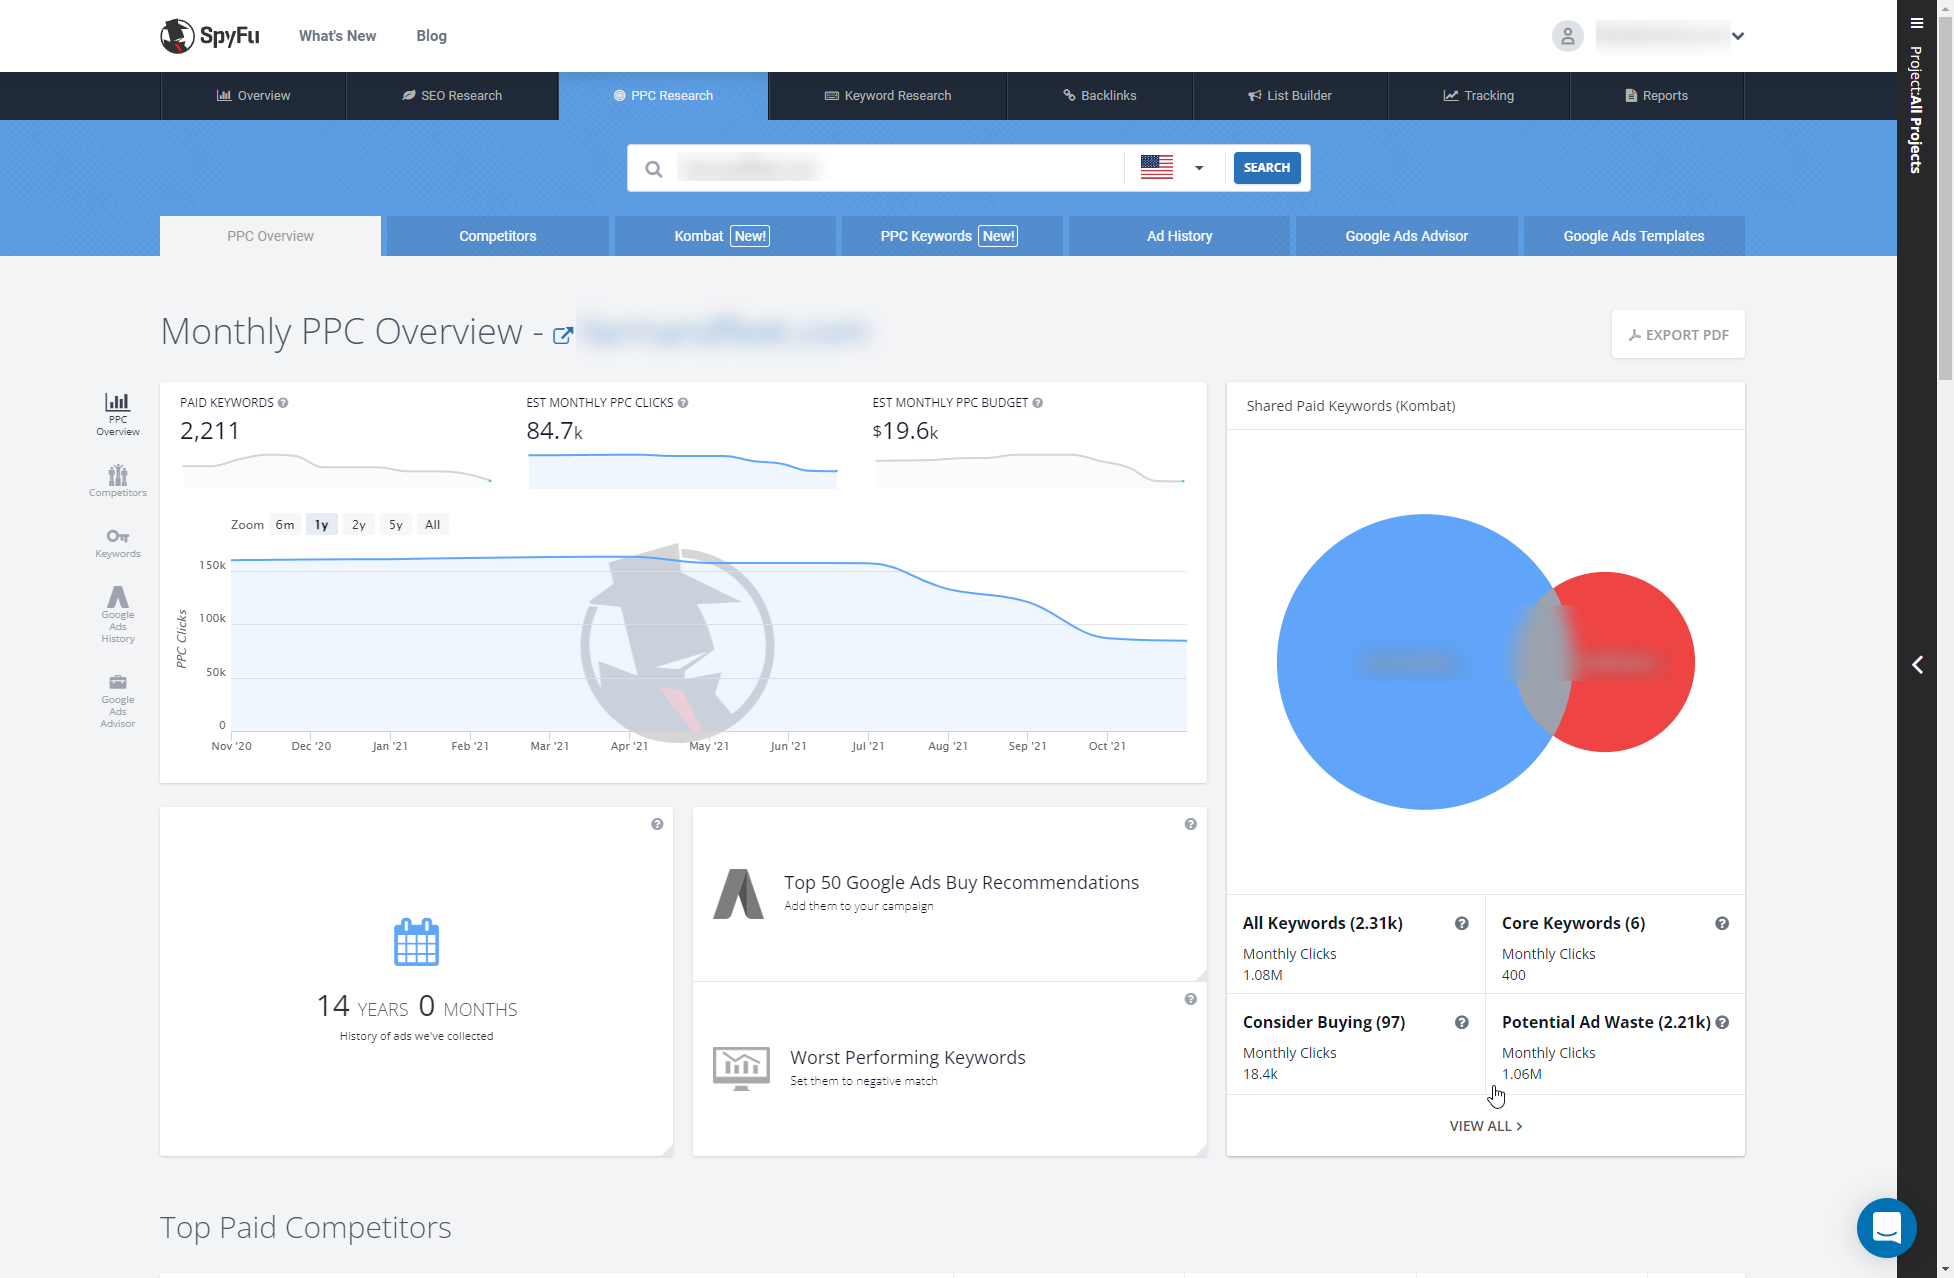
Now let’s check if they have increased bidding. We can see that for a few months this company has spent a lot less on advertising. So we can learn from all these data points that they improved performance from promotions and possibly enhanced data quality. So that means these are the two areas you should focus on.
While all the above points are fantastic, in identifying improvements, there is also one fundamental that trumps all the above. And that is your data feed quality. A competitor that has a lot of improvements, such as better titles, description, variant attributes, product details, highlighters, etc. Will have a higher ranking than you would.
Not only that, reviews play a significant role in trust, which Google also considers when ranking your ad auctions.
Where Can I Find The Report?
Go to Google Merchant Center > Performance > Competitive Visibility